
8 AI Agents to improve your Sales Win Rate
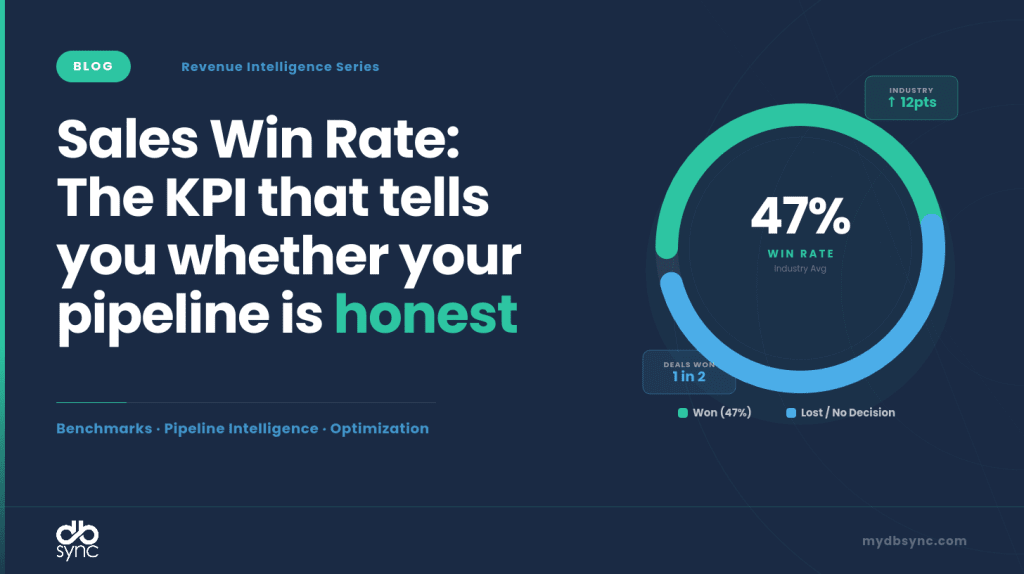
Table of Contents
What it measures
Percentage of closed deals won vs. total opportunities reaching a decision point.
Formula
Win Rate = (Deals Won ÷ (Deals Won + Deals Lost)) × 100
Worked example
Your team closes 84 deals and loses 36 → Win Rate = 84 ÷ (84 + 36) × 100 = 70%. But if you include the 45 deals still open or stalled in the denominator, that number collapses to 47%, a 23-point swing from the same pipeline.
That gap is why sales win rate is one of the most misread metrics in B2B sales.
What Win Rate Actually Tells You
Win rate is not a vanity number. It is a diagnostic. A falling win rate, even while revenue grows, signals that your pipeline is inflating faster than your team’s ability to close. A rising win rate in a shrinking pipeline signals over-qualification, where reps are only pursuing safe deals and leaving revenue on the table.
According to HubSpot’s survey of over 1,000 sales reps, the average B2B sales team wins roughly 21% of its deals, meaning nearly four out of five opportunities are lost. Yet when you ask most sales leaders what their win rate is, they quote numbers between 30% and 50%. The gap isn’t dishonesty, it’s a measurement inconsistency.
Three decisions live or die on this number: how much pipeline coverage you actually need, where to deploy coaching resources, and which deal segments are worth your team’s time.
The Denominator Problem: Why Most Teams Measure This Wrong
There are at least five ways to calculate win rate, and each one produces a different number from identical data.
The most common formula Wins ÷ (Wins + Losses) is also the cleanest. It counts only deals that reached a final decision and asks of those, how many you win? Excluding “no decision” outcomes inflates your number by 10–15 percentage points. A team that reports a 47% win rate using closed-only math may actually be closing 29% of all qualified opportunities they touch.
Common measurement mistakes:
- Blending segments: Mixing SMB, mid-market, and enterprise deals into a single win rate hides that enterprise deals are losing at twice the rate of SMB.
- Counting re-opened deals as new opportunities: Inflates denominator accuracy and creates ghost wins in your trend line.
- Starting the clock too early: Including leads that were never real opportunities makes every metric worse without surfacing actionable problems.
- Not defining “closed lost”: If reps mark deals as “nurture” instead of lost to avoid the stat, your win rate is fiction.
Industry Benchmarks (2025–2026 Data)
The average B2B sales team wins roughly 21% of its deals overall. That number rises to 29% when you count only qualified opportunities, a gap that matters enormously for pipeline planning.
| Industry | Typical Range | Top Quartile | Primary Source |
| Professional Services | 25–40% | 40%+ | Forecastio / First Page Sage 2026 |
| Healthcare & MedTech | 22–28% | 30%+ | Data-Mania 2026 |
| SaaS Mid-Market | 15–25% | 28%+ | Optifai B2B SaaS Study 2025 |
| SaaS Enterprise (>$100K ACV) | 12–18% | 22% | Winning by Design / Salesmotion 2026 |
| Financial Services | 16–22% | 26% | Digital Bloom 2025 |
| Manufacturing | 10–20% | 22% | First Page Sage 2026 |
| IT Services / SaaS & Tech | 20–24% | 28% | Data-Mania 2026 |
Only 13% of teams consistently hit 40%+ win rates. If
Deal-size segmentation matters more than industry
Win rates decrease as deal size increases. Under $50K deals see 25–35%, $50K–$250K deals land at 18–28%, and enterprise deals above $250K sit at 12–22%. Larger deals average 13 decision-makers per enterprise deal in 2026, meaning more people who can say no and more time for deals to stall.
Counterintuitive benchmark
Opportunities closed within 50 days show a 47% deal success rate. After 50 days, that drops to 20% or lower. Speed is not just a sign of a healthy deal, it is a predictor of the outcome itself.
Threshold interpretation
- Above 40%: Your team may be under-qualifying or cherry-picking safe deals. High win rates can signal missed revenue.
- 20–35%: The healthy zone for most B2B teams. A mix of high-probability deals and strategic bets.
- Below 15%: Likely signals lead quality problems, ICP misalignment, or fundamental gaps in the sales process.
Agents: AI Agent Workflow for Win Rate
AI does not improve win rate by replacing reps. It improves win rate by making the right information available at the right moment, before a deal goes cold, before a competitor gets mentioned without a response, before a stalled deal disappears from view.
Organizations that have embedded AI into their core go-to-market strategies are 65% more likely to increase their win rates than competitors still treating AI as optional. More granularly, sellers who use AI to inform their deals increase win rates by 26%, and sellers who use AI to actively guide their deals increase win rate by 35%.
Here is the agent architecture that drives those results:

All Eight Agents
| # | Agent | Category | One-line Purpose |
| 1 | Deal Scoring | Qualification | Predicts win probability and ICP fit for every active opportunity — before reps waste time on the wrong deals. |
| 2 | Conversation Intelligence | Coaching | Records, transcribes, and analyzes every sales call to surface winning talk tracks, objection patterns, and competitor mentions in near real time. |
| 3 | Win-Loss Analysis | Pattern recognition | Runs on every closed deal to extract the patterns separating wins from losses — at scale, without manual tagging or analyst time. |
| 4 | Next-Best-Action | Rep guidance | Delivers a prioritized daily action card to every rep — telling them exactly which deals to touch, in what order, and why. |
| 5 | Rep Actions | Daily execution | Converts AI insights into ready-to-execute rep assets — pre-written emails, call prep briefs, and battlecards — so reps spend time selling, not writing. |
| 6 | Manager View | Pipeline oversight | Gives frontline managers a continuous, AI-synthesized view of team pipeline health, rep performance, and deals that need their attention today. |
| 7 | Exec Reporting | Forecast & strategy | Delivers board-ready win rate trends, forecast commits, and strategic signals to sales leadership — synthesized from live pipeline data, not manual roll-ups. |
| 8 | Feedback Loop | Continuous learning | Closes the system — using outcomes from closed deals to continuously retrain scoring models, refine prompts, and update ICP definitions so every agent improves over time. |
How the AI Agents Work Together
The agents are not independent tools, they form a closed-loop revenue intelligence system. Here is how data flows across the stack:
- Deal Scoring assigns win probability and ICP tier to every opportunity. This score is the primary input that determines which deals surface in the Next-Best-Action agent.
- Conversation Intelligence analyzes every call and updates the deal record in real time. Its risk flags and coaching data also feed the Manager View and Win-Loss Analysis agents.
- Win-Loss Analysis fires on every closed deal and feeds its pattern library back into Deal Scoring, making the scoring model more accurate over time.
- Next-Best-Action synthesizes deal scores, engagement signals, and intent data to produce the daily action list that drives Rep Actions.
- Rep Actions converts all upstream outputs into zero-friction rep-ready assets: emails, briefs, battlecards.
- Exec Reporting synthesizes the full pipeline and win rate trends into a 5-minute board-ready narrative with a forecast commit and strategic signal.
- Feedback Loop closes the system, comparing predicted outcomes to actual results and recalibrating scoring weights, prompt logic, and ICP definitions on a monthly cycle.
Agent 1: Deal Scoring
Predicts win probability and ICP fit for every active opportunity, before reps waste time on the wrong deals.
Agent 2: Conversation Intelligence
Records, transcribes, and analyzes every sales call to surface winning talk tracks, objection patterns, and competitor mentions in near real time.
Agent 3: Win-Loss Analysis
Runs on every closed deal to extract the patterns separating wins from losses, at scale, without manual tagging or analyst time.
Agent 4: Next-Best-Action
Delivers a prioritized daily action card to every rep, telling them exactly which deals to touch, in what order, and why.
Agent 5: Rep Actions
Converts AI insights into ready-to-execute rep assets, pre-written emails, call prep briefs, and battlecards, so reps spend time selling, not writing.
Agent 6: Manager View
Gives frontline managers a continuous, AI-synthesized view of team pipeline health, rep performance, and deals that need their attention today.
Agent 7: Exec Reporting
Delivers board-ready win rate trends, forecast commits, and strategic signals to sales leadership, synthesized from live pipeline data, not manual roll-ups.
Agent 8: Feedback Loop
Fires on every closed deal (won or lost) to compare predicted score vs. actual outcome. Also runs a monthly model calibration cycle and a quarterly prompt review based on accumulated drift signals.
Analytics: Win Rate Dashboard
A good win rate dashboard does four things: shows the headline number, trends it over time, segments it by deal size and rep, and surfaces the stage where deals are dying. Here’s what that looks like:
The stage-level view is the most actionable panel. If your losses cluster at the proposal stage, the problem is likely pricing or proof-of-value. If losses spike at demo, you have a qualification issue; you’re probably showing the product to the wrong people. The root cause diagnosis changes the intervention entirely.
Integration: Integration Architecture
Win rate is a lagging indicator; by the time it moves, the damage is done. The only way to catch problems in time is to connect the data sources that influence it into a live reporting layer. Here is how that architecture looks:
Where data quality breaks down
The most common failure is CRM data rot. When reps skip updating the stage, outcome, and close date fields, the denominator in your win rate formula becomes unreliable. A single unmeasured “no decision” categorized as open keeps a lost deal invisible for months. Clean, stage-gated CRM hygiene is a prerequisite for any win rate analysis to be meaningful.
Seven Tactics That Actually Move Win Rate
1. Fix the denominator first. Agree on a single formula across every rep, manager, and RevOps analyst. If you’re measuring win rate five different ways, you’re having five different conversations about the same pipeline.
2. Segment by deal size, not just overall. If you’re selling $50K+ deals and your win rate is above 22%, you’re in the top quartile. Below 15% means there’s a structural problem worth diagnosing.
3. Prioritize speed to close. Teams with rapid response times see 35% higher win rates, and deals where multiple decision-makers are engaged early show 45% higher win rates.
4. Multi-thread every enterprise deal. Single-threaded deals with those where only one contact is engaged, die when that contact leaves, gets reorganized, or loses internal support.
5. Mine your loss data. A tagged loss reason field in your CRM, cleaned up and trended quarterly, is worth more than a consultant. If 40% of losses are going to a single competitor, that is a product or positioning problem, not a sales execution problem.
6. Use relationship leverage. Champify’s 2025 Impact Report found that selling to known contacts, former customers, and past champions who changed jobs delivers a 37% win rate compared to 19% for cold outreach. Warm your pipeline before you work it.
7. Implement conversation intelligence. If you don’t know what your top reps say in the first 10 minutes of a demo, you’re guessing at the recipe for your own best outcomes.
FAQs
What is a good win rate for B2B SaaS?
A good sales win rate typically ranges from 20–30% for most B2B SaaS companies, with top performers achieving 35% or higher. Enterprise deals typically see win rates of 20–25%, while SMB-focused sales teams often achieve 30–40%.
Should I exclude “no decision” from my win rate?
Yes, for most purposes. Including open and no-decision deals in the denominator gives you a more conservative overall funnel view, which is useful for pipeline planning. But for measuring competitive effectiveness and coaching decisions, use closed-only math. Track both numbers with clear labels.
Can a win rate that’s too high be a problem?
Above 40%, your team might be under-qualifying or only pursuing safe deals. High win rates can actually signal missed revenue if reps avoid stretch opportunities.
How often should I review win rate?
Weekly at the segment and rep level for in-quarter coaching. Monthly for trend analysis. Quarterly for ICP and process reviews. Annual for benchmark comparison.
What is the fastest lever to move win rate?
The evidence points to a deal qualification. Teams using AI qualification report 50% better ICP accuracy, which directly lifts win rates by ensuring reps only work accounts that genuinely fit. Getting the right deals into the pipeline gives not just more deals, but it is the highest-leverage input.
Win rate vs. close rate: what’s the difference?
Win rate counts only closed opportunities (won + lost) in the denominator. Close rate sometimes includes all open opportunities. Win rate is the more useful metric for competitive benchmarking. Close rate can be more useful for measuring full-funnel efficiency.
Sources
- HubSpot 2024 Sales Trends Report – average B2B win rate, 1,000+ reps
- Salesmotion 2026 Win Rate Benchmark Guide – deal-size segmentation, formula analysis
- Optifai B2B SaaS Pipeline Study, Q1–Q3 2025 – 847-company ACV cohort data
- Champify 2025 Impact Report – known contact vs. cold win rate
- Landbase Win Rate Benchmarks 2026 – deal-size and stakeholder data
- Forecastio 2026 – tactical win rate improvement levers and implementation data
- First Page Sage / Data-Mania 2026 – industry vertical benchmarks
- Gong Labs State of Revenue AI 2025 – AI win rate impact, 7.1M opportunity analysis
- VentureBeat / Gong 2025 – 77% revenue per rep finding, 65% more likely to improve win rates
- ORM Tech / Gong Labs 2025 – 8–12% win rate improvement via conversation coaching