A Simple Guide to Sales Analytics
Unlock Growth and Performance
As a salesperson, sales manager or business owner, you must constantly track your sales performance to drive growth, evaluate your sales strategies’ effectiveness, and identify improvement areas. Sales analytics is an essential component of your day-to-day operations.
In this guide, we will take you through a simple step-by-step process for getting started with sales analytics. We will also explore the tools and metrics needed to gather and analyze sales data.
What is Sales Analytics?
Sales analytics is collecting, analyzing, and interpreting sales data to provide insights that can help you optimize your sales strategies, increase revenue, and improve performance. Sales analytics can help you identify the strengths and weaknesses of your sales process so that you can make data-driven decisions that deliver results. While sales analytics provides valuable insights into sales operations, business intelligence (BI) tools offer a broader perspective by integrating sales data with information from other areas of the organization, i.e sales, finance, marketing, and supply chain providing a holistic view of overall business performance.
Start Your 14-Day Free Trial
- Pre-built connectors and ready-made integration templates
- Real-time and bi-directional data sync
- Self-healing automation - zero babysitting
Sales Analytics Techniques
Several techniques are used in sales analytics, each providing unique insights into a company’s sales performance. Some of the most commonly used methods include:
Sales Forecasting uses historical sales data and other relevant information to predict future sales trends. Companies can adjust their inventory levels, pricing strategies, and marketing efforts by forecasting future sales to maximize profits.
Customer Segmentation: Divide customers based on shared characteristics, such as demographics, buying behavior, or product preferences. By segmenting customers, companies can develop targeted marketing campaigns and tailor their product offerings to meet each group’s needs better.
Product Analysis: This involves analyzing sales data to identify which products are selling well and which are not. Companies can adjust their inventory levels and marketing strategies by understanding the most popular products to maximize sales.
Sales Funnel Analysis: This involves tracking the customer journey from initial contact to making that final purchase and analyzing the effectiveness of each stage of the sales process. By identifying areas where customers are dropping off, companies can make changes to improve the conversion rate and increase sales.

 Sync data from Salesforce to ChannelAdvisor
 Sync data from Salesforce to QuickBooks Desktop
What Tools for Sales Analytics
Several tools and software can help you analyze your sales data, providing more insights and predictions for future sales. The most common tools in sales analytics include:
- Salesforce: A CRM (customer relationship management) tool assists businesses with tracking their sales process, managing customers, and gather sales data.
- Tableau: Tableau helps businesses visualize and analyze data. Tableau allows users to create interactive dashboards, visualizations, and charts to explore their data.
- Power BI(Business Intelligence): Microsoft Power BI is a business analytics service that offers businesses interactive visualizations and business intelligence capabilities. Depending on your business needs, you can choose different Power BI license types to access varying levels of features and capabilities, ensuring you get the right tools for your data analysis requirements. Power BI can be connected to different data sources, including sales data, to generate interactive visuals and dashboards.
- Excel: Excel is a spreadsheet software program that provides built-in analytical tools for analyzing sales data. Excel lets you make charts, pivot tables, and graphs to visualize your sales data and identify patterns.
| Sales Analysis Category | Description | Purpose | Benefits |
| Sales Forecasting | Use of historical data and other information to predict future sales trends | Adjust inventory levels, pricing strategies, and marketing efforts to maximize profits | Allows for adjustments to inventory, pricing, and marketing strategies to maximize profits |
| Customer Segmentation | Dividing customers into groups based on shared characteristics for targeted marketing campaigns and tailored product offerings | Develop targeted marketing campaigns and tailor product offerings to meet the needs of each group | Improves marketing efficiency and customer satisfaction |
| Product Analysis | Analyzing sales data to gain insights into product popularity and adjust inventory and marketing strategies accordingly | Adjust inventory levels and marketing strategies to maximize sales | Maximizes sales by focusing on popular products |
| Sales Funnel Analysis | Tracking the customer journey from initial contact to final purchase and analyzing the effectiveness of each stage of the sales process | Improve the conversion rate and increase sales | Helps companies identify areas for improvement in the sales process, reduces customer churn, and increases revenue |
Key Metrics for Sales Analytics
To make informed business decisions, it’s essential to focus on key metrics that provide valuable insights into your sales performance. These include:
- Sales Growth: Sales growth refers to the percentage increase over a specific period, which indicates the overall direction of sales volume.
- Win/Loss Rate: The win rate refers to the percentage of successful sales transactions compared to the total sales transactions. The loss rate identifies the number of unsuccessful sales transactions.
- Revenue: Money generated from sales transactions.
- Customer Acquisition Cost (CAC): The total cost to acquire a new customer, including marketing and sales expenses.
- Customer Lifetime Value (CLV): The total revenue a customer will generate over their lifetime with your company.
- Conversion Rate: The percentage of leads converted into successful sales transactions.
- Churn Rate: Percentage of customers who stop business with a company during a given period
Where to Start on Your Sales Analytics Journey
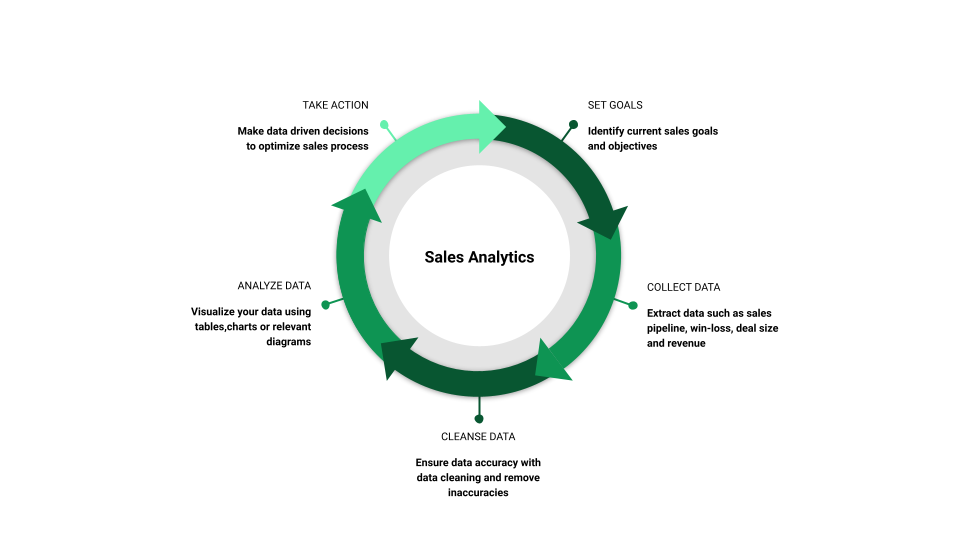
- Set Your Goals: Begin by identifying your current sales goals and objectives. What do you want to achieve through your sales strategies? What metrics are essential to measure your success?
- Collect Your Data: Collect data related to your sales process, including your sales pipeline, win/loss rates, deal size, and revenue. You can get this data from various sources, including sales software, CRM systems, and spreadsheets.
- Cleanse Your Data: Ensure that your data is accurate by cleaning and correcting any errors or inconsistencies that may affect your analysis results.
- Analyze Your Data: Visualize your data using tables, charts, or diagrams. Identify patterns, trends, or insights that can help you make informed decisions.
Conclusion
Sales analytics is an essential process for every sales team or department. By collecting and analyzing sales data, businesses can understand their sales performance, make data-driven decisions, and optimize their sales strategies to drive revenue growth. Moreover, as technology evolves, sales analytics capabilities will only expand. By focusing on key metrics, businesses can use data to improve the effectiveness and efficiency of their sales process. Where do you stand in your sales journey? This guide is just the beginning, Get started today!
FAQs
What is the primary reason for sales analytics?
The purpose is to gather, examine, and explain selling data for purposes of maximizing sales plans, revenues, and total sales performance.
What would be some basic sales analytics practices?
Sales projections, customer segmentation, product analysis, and sales funnel analysis.
What are the most popular tools used in sales analytics?
Salesforce, Tableau, Power BI, and Excel.
What are the key metrics to monitor in sales analytics?
Revenue, win/loss rate, customer lifetime value (CLV), customer acquisition cost (CAC), sales growth, conversion rate, and churn rate.
Where do you start a sales analytics journey?
By establishing goals, gathering data, cleaning data, and analyzing data to provide actionable insights.